What can the 1929 crisis teach us about the dangers facing the economy today?
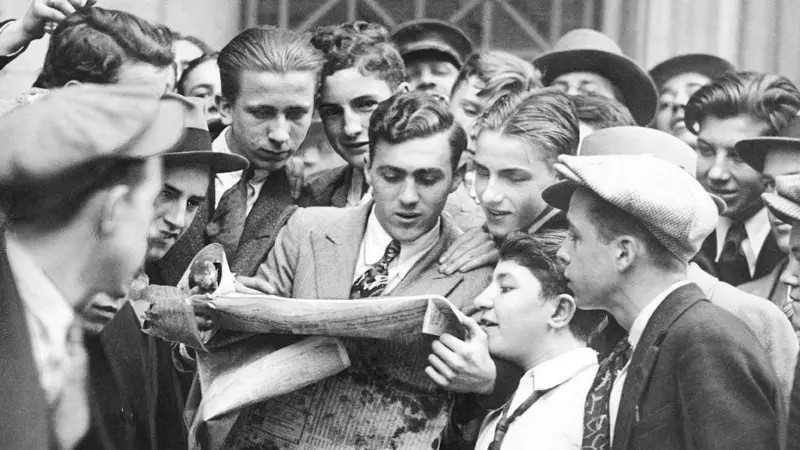
Broker's messengers crowd around a newspaper after Wall Street's first stock market crash on October 24, 1929
Getty Images via BBC
For many economists, the indicators currently recorded by the New York Stock Exchange - and have been for some time - are disconcerting.
Despite several years of conflict in Ukraine and the Middle East, with the sudden closure of the Strait of Hormuz, which caused chaos in the global energy market, the stock market continues to rise.
In February, the Dow Jones index - which represents the average value of the 30 largest American companies - surpassed its historic high of 50 thousand points and now in June it had already surpassed 52 thousand.
At the end of May, the S&P 500 index managed to maintain a sustained increase in the price of its shares for nine consecutive days - something rare on Wall Street - and, thanks to the explosion of artificial intelligence, the Nasdaq index continues to reach historic records.
Although this increase could, theoretically, be a good sign for the American economy, some are beginning to draw parallels with the years leading up to the biggest financial crisis in history: the Stock Market Crash of 1929.
The BBC podcast More or Less spoke with Andrew Ross Sorkin, author of 1929: Inside the Greatest Crisis in the History of Wall Street - and How It Shook the World (Companhia das Letras) and Too Big to Fail (Too Big to Fail). crash, in free translation) to analyze the similarities and differences between the current situation and the period before the crash of 1929.
Sorkin highlights how people were going into debt to invest before the crash of 1929
Getty Images via BBC
BBC - For those of us familiar with the history of finance, no date is more significant than 1929. But for those who, fortunately, have forgotten: what was the Great Stock Market Crash of Wall Street?
Andrew Ross Sorkin - The Great Stock Market Crash of 1929 is considered the first and most severe crash of the US stock market.
The 1920s were a time of great prosperity and dynamism.
Automobiles, radio and all that enthusiasm for new technologies that would change the world appeared.
In addition, it was the first time that ordinary people were able to invest in the stock market. They watched the market rise steadily. And, in October 1929, it broke down; and it broke with tremendous force.
BBC - I wanted to get an idea of the magnitude of this break. It is called the "Great Break". Is it correct to say that it was the biggest financial crisis in history? Is there any way to quantify it?
Sorkin - I believe that if we analyze not only the year 1929, but the period between 1929 and 1933, we will observe a drop of approximately 90% in the total value of the market.
It is worth mentioning that, interestingly, in 1929 - although we all remember that year as a great crash - the stock market closed with a drop of just 17%.
But...
Between October and November 1929, the market fell by almost 50%.
So if someone closed their eyes and simply compared the beginning of the year with the end, they might think that nothing had happened; in addition to that extraordinary 50% drop that occurred at a time when ordinary people were investing in the stock market for the first time, often taking on considerable levels of debt, in some cases with a debt/equity ratio of 10 to 1.
BBC - This aspect deserves to be explored further. So if I have $100, I borrow $1,000 to buy shares at that value, and those shares fall to $500, I will have lost five times as much money as I actually had.
Sorkin - And you have a big problem.
This explains what I consider to be the first domino in a series of events leading - as just mentioned - to the 90% drop by 1932 or 1933.
And by the way, in 1932, the unemployment rate also reached 25%.
The crash of the New York Stock Exchange in 1929 had an immense impact on the economies of the US and the world
Getty Images via BBC
BBC - One of the Your job, Andrew, is to appear on television talking about finance. And as you speak, numbers appear at the bottom of the screen: whether the stock market is rising or falling, the price of individual stocks, the dollar, crude oil... There is an absolutely ubiquitous availability of data.
It is true that in 1929 the teletype already existed, which printed stock prices, but the situation was very different.
What was different, and did the lack of data at that time make the situation better or worse?
Sorkin - I would say that the lack of data - and, More importantly, the lack of real-time data - wasn't just a problem.
In fact, in some cases, it can be described as the factor that triggered the crisis.
In some cases, we were literally four, five, or six hours late.
When you see those famous black and white photos of thousands of people during the Great Depression, gathered around the New York Stock Exchange - perhaps you've seen them over the years - you may have asked yourself, "What are they doing?" doing? Why are all these people on the street?"
All these people had gone to Wall Street to try to find out, in person, what had happened to their money.
They didn't know what the stock prices were. Because if you were at a brokerage house - say, on Fifth Avenue, near 40th Street - you might be three hours late; and forget if you were in Europe or on a ship somewhere.
And by the way, people traded on ships. You could be up to two days late.
So one of the things that happened was that people realized how out of sync the stock pricing system was and they said, "I'm going to sell everything; I can't even participate in this."
In October 1929, terror gripped investors on the New York Stock Exchange
Getty Images via BBC
BBC - Is there any way to know how vulnerable you are in a crisis? I mean, from a historian's perspective, you can look at ratios and graphs, but is there any way to notice this as it happens?
Sorkin - You see, what I always look at is debt.
For me, the leverage of the system is the match that lights the fire. That's why what I always look at - whether in the moment or in retrospect - is how much debt there is in the system at a given time, because that's what usually triggers the crisis and often contributes to inflating the multiple.
So that's another thing you can look at: what the multiple is at a given time. You can use the price-to-earnings (P/E) ratio or any other metric to try to understand how a stock is being valued compared to others.
BBC - And when we talk about "multiple", a classic example is simply asking: how expensive is this stock in relation to the profits the company generates? If the company earns $1 per year and the stock is priced at $10, the multiple is 10. If the company earns $1 per year per share and the stock is worth $100, then the multiple is 100. Efforts have been made to plot these price/earnings multiples (or P/E ratios) over the long term.
Sorkin - If you look at the charts from that era, you will see that if looks like a mountain; you can see the peak. Looking back, it's clear. Although, if you were there at the time, you might not have realized it was the peak.
BBC - Well, you know it went up. What you don't know is whether it will go up more.
Sorkin - Exactly. You don't know if you're at the top of the mountain or if the mountain will keep growing... above the tree line, so to speak.
In fact, similar "mountains" can be seen in the 1970s and also in the late 1990s.
'People came to Wall Street to try to find out for themselves what had happened to their money,' explains Andrew Ross Sorkin.
Getty Images via BBC
BBC - I actually wanted to tackle this topic because one of the reasons why 1929 is so interesting - it's a fascinating story as you tell it - is that it also tells us something about the present and other crises. If we look at that "mountain", how does the peak reached in 1929 compare to, say, the 1970s, the Internet bubble, or even today?
Sorkin - Well, it seems high, but compared to these other peaks, it's a lower peak, so to speak.
However, if we look at the evolution over that period, we see how it steadily rises. And then we see the fall, like a real rollercoaster... although I'm mixing metaphors now.
BBC - In 1929, the graph reaches a very steep peak, just above 30. In other words, the share price is equivalent to 30 times the average earnings of the previous ten years. Then it drops and never approaches that value again. Later, in the late 1990s and early 2000s - during the internet boom - it rose even more, surpassing the 40 mark. Then it fell again. Now, it has surpassed the 40 mark once again. This is only the second time in history that it has reached a level higher than the peak before the crash of 1929. Can we draw any conclusions from this?
Sorkin - Without a doubt. We can conclude that it is likely that at some point - although we don't know when - there will be another crash.
And that is the big existential question for us all.
A sharp revaluation of share prices during the 1970s led to the dreaded 'stagflation': high inflation, low growth and soaring unemployment.
Getty Images via BBC
Source: G1